Trading Strategies: Types, Methods and Risk
How trading strategies are classified by time horizon, market behaviour, analytical method, instrument and execution, and where each family's risks lie.
From scalping and trend-following to arbitrage, option spreads and volatility trading. Understand how trading strategies are classified, what each attempts to capture, and where the risks lie.
What is a trading strategy?
A trading strategy is a defined approach to identifying opportunities, entering positions, managing exposure and exiting trades.
A strategy should answer more than whether a stock or index is likely to rise or fall. It should specify what is traded, why the opportunity is expected to exist, how long the position may remain open, what conditions invalidate the trade and how much capital is exposed.
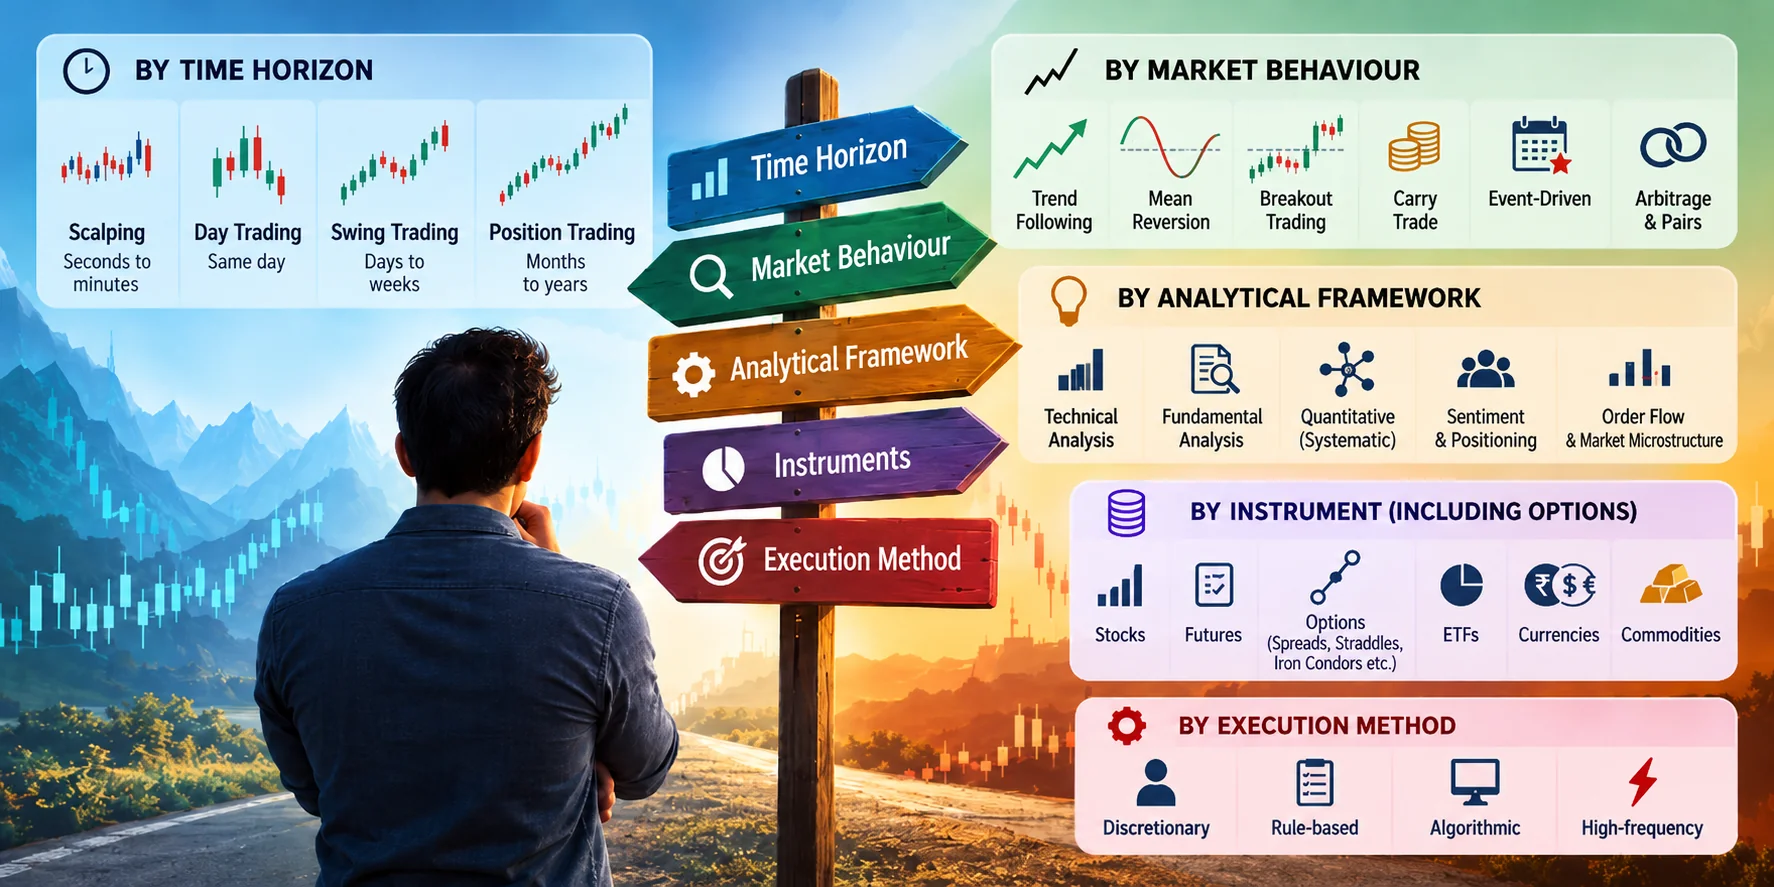
There are many ways to classify strategies, and the categories overlap.
A trader might follow trends using a moving-average system, hold positions for several days, trade NIFTY futures and place orders automatically. That is simultaneously a swing-trading, trend-following, technical and systematic strategy.
The classifications below describe different dimensions of trading rather than mutually exclusive choices.
1. By time horizon
Time horizon describes how long a trader generally intends to hold a position.
| Trading style | Typical holding period | Principal considerations |
|---|---|---|
| Scalping | Seconds to minutes | Spread, slippage, fees, liquidity |
| Day trading | Within one trading session | Intraday volatility, execution, position limits |
| Swing trading | Days to weeks | Overnight gaps, intermediate trends |
| Position trading | Weeks to months or longer | Major trends, financing, drawdowns |
Scalping
Scalping attempts to profit from small, short-lived price movements.
A scalper may execute many trades during a session. Because the intended profit per transaction is often small, transaction costs and execution quality are particularly important.
Scalping can use order-book signals, momentum, mean reversion, short-term price patterns or quantitative models.
A high proportion of winning trades does not necessarily make scalping profitable if occasional losses and transaction costs exceed the accumulated gains.
Day trading
Day traders generally open and close their intended exposure within the same trading session.
They may trade equities, futures or options using price patterns, technical indicators, order flow or event-driven signals.
Closing positions intraday generally avoids ordinary overnight exposure, but does not eliminate sudden intraday gaps, liquidity disruptions or the possibility that an intended closing order fails to execute.
A broker’s automatic square-off facility is not a guarantee of successful exit.
Swing trading
Swing trading seeks to capture price movements lasting several sessions or weeks.
Strategies may follow intermediate trends, trade reversals near defined price levels or enter after breakouts.
Swing traders typically make fewer decisions than scalpers, but accept greater overnight event exposure.
Position trading
Position traders seek to capture larger trends over extended periods.
They may combine technical trends, economic developments, company fundamentals and portfolio-level analysis.
Position trading is not the same as passive investing. The position is still governed by a trading thesis and identifiable exit conditions.
The holding period does not determine the strategy’s profitability. It changes the balance between trading costs, market noise, overnight risk and capital commitment.
2. By market behaviour
This classification describes the economic or market pattern a strategy attempts to exploit.
Trend following
Trend following attempts to participate in an established directional movement.
A trader may buy when an asset demonstrates sustained strength or sell short when a declining trend meets predefined criteria.
Common tools include moving averages, channel breakouts and trailing exits.
A trend-following system may experience repeated small losses in sideways markets before capturing a larger sustained move.
Its central difficulty is that trends are identifiable only imperfectly in real time.
Momentum trading
Momentum strategies seek assets or markets exhibiting relative or absolute strength.
Relative momentum might compare several stocks and favour those with stronger recent performance.
Absolute momentum might establish a position only when an asset’s measured return exceeds a predetermined threshold.
Momentum overlaps with trend following, but they are not identical. Momentum often emphasises measured return strength or relative ranking, while trend following commonly uses directional regimes and associated entry and exit rules.
Both are vulnerable to sudden reversals.
Mean reversion
Mean-reversion strategies attempt to profit when prices or relationships move away from a reference level and subsequently return toward it.
Possible reference measures include moving averages, statistical bands, relative valuations and price differences between related assets.
A mean-reversion strategy must define what constitutes an unusual deviation and when that deviation is no longer expected to reverse.
The main danger is treating a genuine structural change as a temporary mispricing.
A stock falling because its business has deteriorated does not have to return to its previous price.
Breakout trading
Breakout strategies enter when price moves beyond a predefined range, support or resistance level, or volatility boundary.
Examples include:
- Opening-range breakout.
- Previous-day high or low breakout.
- Donchian-channel breakout.
- Volatility-expansion breakout.
Breakouts may develop into trends, but many fail and reverse.
Confirmation rules, volatility filters and risk limits can modify the outcome, although no filter eliminates false signals.
Reversal trading
Reversal strategies anticipate that an existing trend is weakening or ending.
They differ from trend-following approaches because the trader may enter against the prevailing direction.
Possible signals include momentum divergence, failed breakouts, exhaustion patterns or fundamental valuation changes.
The challenge is distinguishing a true reversal from a temporary pause.
Range trading
Range trading attempts to exploit movement between identifiable upper and lower price regions.
It is related to mean reversion but specifically assumes the market remains within a bounded trading range.
A successful breakout can invalidate that assumption and produce a large loss for a trader positioned against the move.
Carry trading
Carry strategies seek returns from differences in financing, interest rates, futures prices, dividends or other holding-period cash flows.
A familiar currency example involves funding a position in a lower-interest-rate currency and holding an asset denominated in a higher-interest-rate currency.
The interest differential does not create a guaranteed profit. Exchange-rate changes, funding costs and rapid position unwinding can overwhelm the carry received.
In futures markets, cash-and-carry strategies examine the relationship between the spot price, futures price, financing costs and other relevant cash flows.
Carry trading and arbitrage overlap in some implementations, but they are not interchangeable.
Event-driven trading
Event-driven strategies are based on identifiable developments such as:
- Company earnings.
- Central-bank announcements.
- Government policy decisions.
- Corporate mergers.
- Index rebalancing.
- Dividend announcements.
- Major geopolitical developments.
Some strategies anticipate an event; others respond after information is released.
The same event may cause a small move, a large gap or a volatility collapse.
Knowing the event date does not mean knowing the market reaction.
Arbitrage
Arbitrage seeks to exploit inconsistent prices among instruments or markets.
A simple theoretical example is an identical asset trading at different prices in two markets, where all trading, funding, transfer and settlement costs can be covered.
In practice, execution timing, short-selling constraints, capital requirements, taxes and settlement mechanics can prevent a theoretical price difference from becoming a riskless profit.
Cash-and-carry arbitrage, conversion/reversal structures and some corporate-action strategies introduce additional operational considerations.
Pairs trading and statistical arbitrage
Pairs trading takes offsetting positions in two related assets based on a model of their relative prices.
For example, a trader may buy one asset and short another when their historical price relationship deviates from an expected range.
This is generally a relative-value or statistical-arbitrage strategy, not guaranteed arbitrage.
Historical correlations can change. Relationships that once appeared stable can break permanently.
3. By analytical framework
A strategy also needs a method for deciding whether an opportunity exists.
Technical analysis
Technical strategies analyse price, volume, volatility and related market information.
Typical inputs include candlestick patterns, moving averages, RSI, support and resistance, price channels and volume.
Technical analysis provides a way of defining trading conditions. The presence of a familiar indicator does not, by itself, establish a profitable edge.
Fundamental analysis
Fundamental strategies examine earnings, cash flows, balance sheets, economic conditions, industry developments and valuation.
Fundamental analysis can support both long-term investments and shorter-term trades.
For example, a strategy might trade an earnings announcement because the reported results differ from market expectations.
An apparently undervalued business can remain undervalued or deteriorate further.
Quantitative and statistical analysis
Quantitative strategies use explicit mathematical or statistical methods to identify and evaluate trading opportunities.
Examples include factor models, momentum rankings, statistical arbitrage, volatility models and machine-learning classifiers.
A strategy is not profitable merely because it uses mathematics or artificial intelligence.
Its estimates must survive realistic testing, transaction costs and changing market conditions.
Sentiment and positioning analysis
Some strategies study options open interest, futures positioning, fund flows, market breadth, sentiment indicators or news.
These measures can provide information about market participation and expectations, but they cannot determine future prices with certainty.
For example, high call open interest at a strike is not an immutable resistance level. Positions can be hedges, spreads or components of other trades, and can change rapidly.
Order-flow and market-microstructure analysis
These strategies examine the mechanics of buying, selling and liquidity.
Inputs may include:
- Best bid and ask.
- Order-book imbalance.
- Executed trade flow.
- Spread.
- Available depth.
- Queue position.
- Short-term price impact.
They are especially relevant to high-frequency and execution-sensitive trading.
Displayed liquidity is not guaranteed liquidity, and rapid cancellations can change the order book before a trade reaches the exchange.
4. By instrument
Different financial instruments produce different payoff structures.
| Instrument | Typical exposure | Distinctive risk |
|---|---|---|
| Equity shares | Direct ownership and price exposure | Business loss, price decline |
| Futures | Contractual directional or spread exposure | Leverage, margin, settlement |
| Options | Nonlinear exposure to price, time and volatility | Premium loss, gamma, volatility and writer obligations |
| ETFs | Exposure to a basket or specified asset | Underlying risk, tracking and liquidity |
| Currency derivatives | Exchange-rate exposure | Currency moves, leverage, regulatory constraints |
| Commodity derivatives | Commodity-price exposure | Contract specifications, margins, delivery or devolvement |
Instruments are the means of expressing a strategy. They are not strategies by themselves.
A bullish market view might be implemented through shares, futures, a long call or a bull call spread. Each has a different cost, risk profile and sensitivity to market conditions.
5. Option Strategies: Expressing Direction, Volatility and Risk
Options deserve separate treatment because their value depends on more than the direction of the underlying asset. An option position is sensitive to the underlying price, to how that sensitivity itself changes, to the passage of time and to implied volatility. Those sensitivities are the Greeks, and the Options chapter defines them. What matters here is that they give a trader several independent axes to take a view on, not just one.
The same strategy name usually describes a payoff at expiry. The value of the position before expiry can also depend on volatility, time, dividends, interest rates and the path of the underlying, so an expiry diagram is a settlement calculation rather than a forecast.
Option strategies are best grouped by what they set out to express.
| Trading objective | Example structures | What the position needs |
|---|---|---|
| Directional, bullish | Long call, bull call spread | The underlying to rise |
| Directional, bearish | Long put, bear put spread | The underlying to fall |
| Large movement, either way | Long straddle, long strangle | A move large enough to cover the premium |
| Limited movement | Iron condor, credit spreads | The underlying to stay in a range |
| Finishing near one price | Iron butterfly, long butterfly and long condor | The range to hold, or the price to be reached |
| Relative pricing across expiries | Calendar and diagonal spreads | The term structure to behave as expected |
| Relative pricing of volatility | Volatility-surface relative-value trades | One implied volatility against another |
| Hedging or covered positions | Protective put, covered call, collar | Reducing an exposure that already exists |
| Dynamic hedging | Delta-neutral positions, gamma scalping | Movement that outweighs what the structure cost |
| Large movement, one direction | Long call or long put, and the ratio spread and backspread variants | A move, accepting an uncovered leg in the spread variants |
That table is a map, not a set of guarantees. A strategy can carry several exposures at once, and a trade entered for a volatility view can still lose on an unfavourable directional move, on time decay or on changing liquidity.
Three warnings apply across the group:
- A bounded contractual payoff is not the same as a small or safe loss. Defined-risk structures bound the arithmetic at expiry, and nothing more. Execution, liquidity, margin and settlement sit outside that bound.
- An uncovered short option carries risk in proportion to the underlying, not to the premium. Premium collected is not guaranteed income and is not comparable to a fixed return.
- A strategy is hedged only if every leg is actually on. A spread whose protective wing did not fill is not that spread.
The construction of each structure, its exact expiry payoff, its break-even prices, its portfolio Greeks and the operational risks specific to options are covered in Option Strategies: Payoffs, Construction and Risk.
6. Hedging versus speculation
The same instrument or strategy can be used for different purposes.
A trader buying a put without holding the underlying may be speculating on a price decline.
An investor buying that same put against an existing shareholding may be hedging downside exposure.
A company using currency futures or forwards may be reducing an existing foreign-exchange exposure rather than seeking trading profit.
Therefore, a strategy’s purpose depends on the broader portfolio and obligations, not only on whether the trade involves buying or selling a particular contract.
A hedge can reduce one risk while introducing cost, basis risk, liquidity risk or other exposures.
7. By decision and execution method
Trading strategies can also be classified according to how decisions are made and implemented.
Discretionary trading
A human trader interprets information and decides when to enter, modify or exit.
Discretionary trading allows adaptation to circumstances not anticipated by a fixed rule set.
Its weakness is that decisions can become inconsistent or difficult to evaluate objectively.
Rule-based trading
A rule-based strategy specifies conditions in advance.
Examples include:
- Buy when a specified breakout condition occurs.
- Exit when a predefined trailing-stop condition is met.
- Limit exposure to a defined proportion of capital.
- Avoid new trades after a daily loss threshold.
Rules can be followed manually or executed by software.
Algorithmic trading
Algorithmic trading uses software to perform specified tasks such as generating signals, sizing orders, submitting orders or managing positions.
A strategy may be fully automated, partially automated or manually supervised.
Algorithmic execution does not establish a profitable trading edge.
Software can submit losing orders faster and more consistently than a human.
A complete automated strategy also needs safeguards for order rejection, partial fills, stale market data, margin shortages, outages and reconciliation between intended and actual positions.
High-frequency trading
High-frequency trading generally involves highly automated, latency-sensitive trading activities, often with short holding periods and substantial attention to market microstructure.
It is not simply another name for scalping or algorithmic trading.
Not all algorithmic strategies are high-frequency strategies, and a discretionary scalper is not necessarily an HFT participant.
8. By source of expected profit
A final classification asks where the proposed trading edge is expected to come from.
Possible categories include:
Directional risk exposure: Profiting when prices move in the anticipated direction.
Trend persistence: Profiting when established movements continue.
Reversion: Profiting when unusual deviations narrow.
Volatility risk premium: Attempting to earn compensation for bearing certain volatility or tail risks.
Carry: Receiving a yield or financing differential while accepting related risks.
Relative value: Trading differences between related instruments.
Liquidity provision: Attempting to earn spreads or other compensation for supplying liquidity while bearing inventory and adverse-selection risks.
Event interpretation: Reacting to the implications of new information.
Structural or behavioural effects: Attempting to exploit persistent market behaviour, constraints or institutional practices.
Not every proposed source of profit is a genuine edge.
An explanation becomes credible only when it is supported by a clearly specified process and suitable evidence.
9. One strategy can belong to several categories
Consider five hypothetical examples.
| Example | Horizon | Market idea | Implementation |
|---|---|---|---|
| Opening-range breakout | Intraday | Breakout, momentum | Futures with predefined rules |
| Moving-average trend system | Swing | Trend following | Equity or futures |
| Earnings volatility trade | Event-driven | Large move or volatility repricing | Long straddle |
| Range-bound index trade | Intraday or short-term | Limited movement | Iron condor |
| Equity relative-value trade | Days to weeks | Statistical mean reversion | Long-short pair |
The fourth example could also be systematic, technically analysed and automatically executed.
This overlapping classification is useful. It identifies what the strategy is actually attempting to do rather than assigning it one marketing label.
10. How to evaluate a trading strategy
Knowing a strategy’s name does not tell you whether it is worth trading.
A useful evaluation should answer:
- What is the opportunity? Why should the strategy have a positive expected return?
- What instruments are involved? Are the contracts liquid and permitted?
- What market conditions help? Trending, sideways, volatile or otherwise?
- What market conditions hurt? Sharp reversals, gaps, volatility shocks or prolonged inactivity?
- How is risk measured? Position size, margin, leverage and portfolio exposure.
- What are the actual costs? Brokerage, taxes, spread, slippage and financing.
- What does the strategy earn after costs? Gross profitability alone is insufficient.
- How robust is the evidence? In-sample, out-of-sample, walk-forward and live results.
- What could invalidate the edge? Market structure, regulation, crowding or changed behaviour.
- What happens when execution fails? Partial fills, rejected legs, stale positions and forced exits.
- How much capital is required? Including adverse scenarios and collateral needs.
- Can the trader tolerate the drawdown? Financially and operationally.
For options, add the effects of implied volatility, Greeks, expiry, exercise, assignment and settlement.
11. Returns, win rate and risk
A strategy with many winning trades is not necessarily profitable.
Consider two hypothetical systems before transaction costs.
System A
Wins 80% of its trades.
Average win: ₹500.
Average loss: ₹2,500.
Expected P&L per trade:
(0.80 × ₹500) − (0.20 × ₹2,500) = −₹100.
System B
Wins 40% of its trades.
Average win: ₹2,000.
Average loss: ₹1,000.
Expected P&L per trade:
(0.40 × ₹2,000) − (0.60 × ₹1,000) = +₹200.
These are simplified expectations based on assumed probabilities, not forecasts.
Costs reduce both results.
The example illustrates why win rate, risk-reward ratio, position sizing and transaction costs must be considered together.
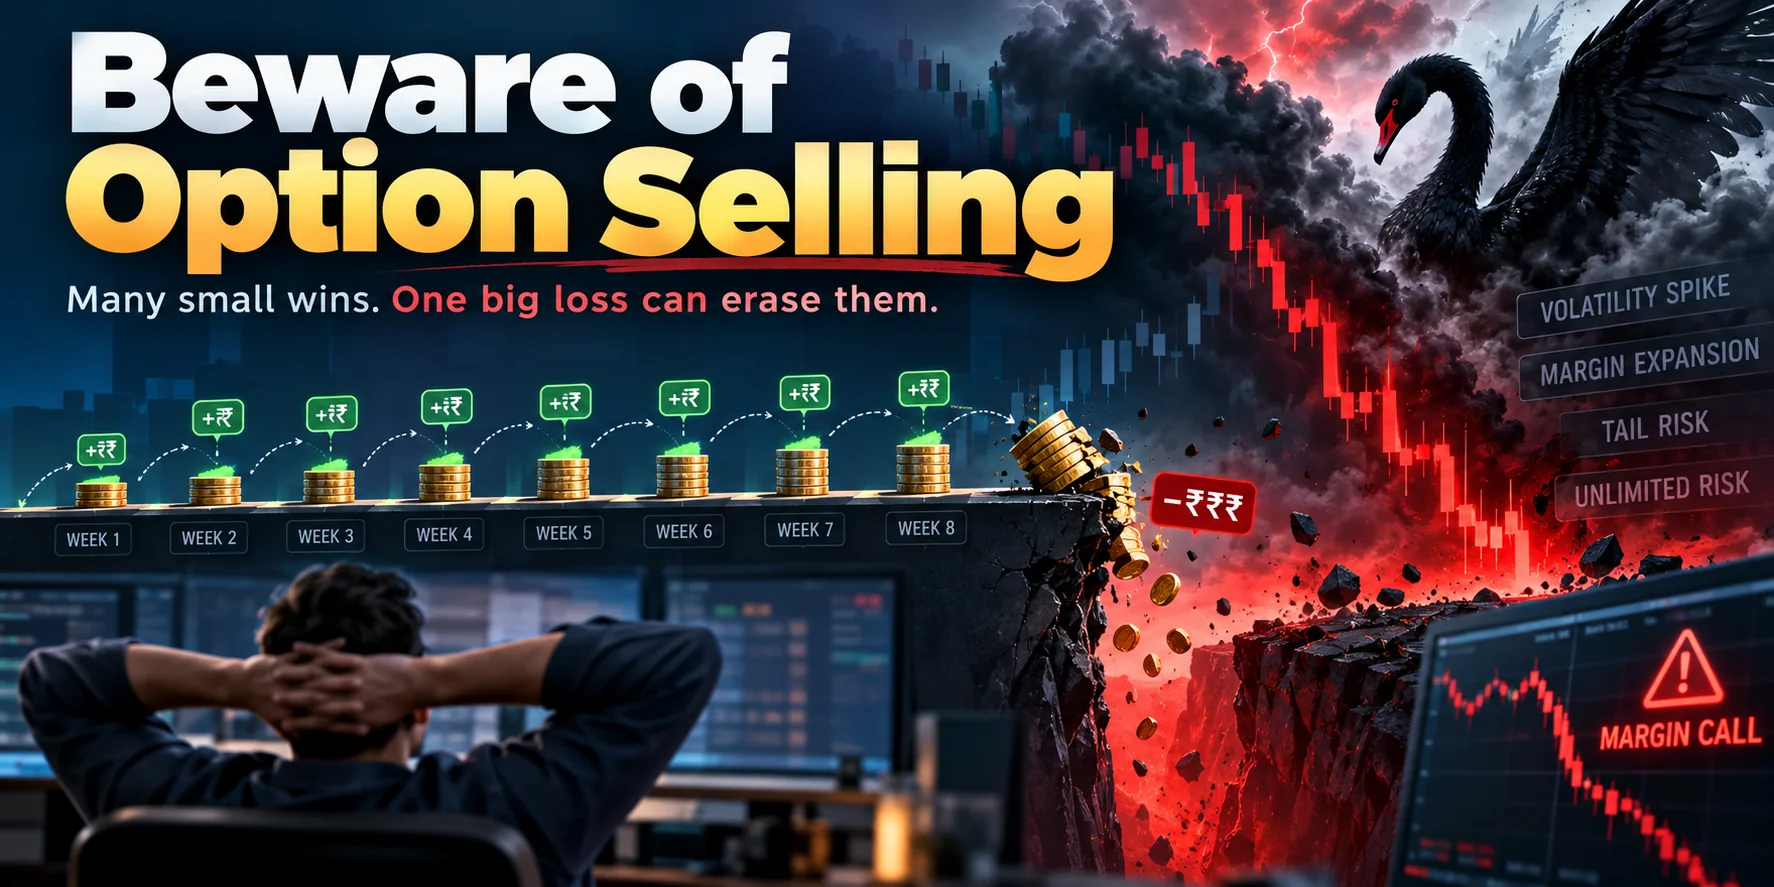
This is especially important when assessing premium-selling strategies that show frequent small gains and occasional large losses.
12. Backtesting does not eliminate uncertainty
A backtest evaluates defined trading rules against historical data.
It can help determine whether an idea performed as expected during the tested period.
However, a backtest may overstate real-world performance when it ignores:
- Look-ahead bias.
- Survivorship bias.
- Incorrect historical prices.
- Trading costs.
- Bid-ask spread.
- Slippage.
- Market impact.
- Liquidity limits.
- Order rejection.
- Changing margins.
- Corporate actions.
- Derivative contract expiry.
- Option exercise and settlement.
- Parameter overfitting.
Out-of-sample and forward testing provide additional evidence, but neither guarantees future results.
A robust strategy should be evaluated across different market conditions, not only the period in which it was developed.
13. Is any strategy consistently profitable?
Different strategies work under different market conditions.
Trend-following can struggle during repeated reversals.
Mean-reversion strategies can suffer when a market establishes a persistent new trend.
Breakout strategies can generate repeated false entries.
Carry trades can experience sudden losses when funding or exchange-rate conditions change.
Option premium-selling strategies can accumulate small gains before substantial losses during volatility shocks.
Long-option strategies can lose their entire premium even when the trader correctly anticipates the direction but overestimates the magnitude or timing of the move.
Arbitrage and relative-value trades can fail because of financing constraints, execution problems or relationships breaking down.
No strategy name implies a positive expected return.
14. The real distinction
The most important classification is not whether a trader is a scalper, swing trader, trend follower or option seller.
It is whether the trader has:
- A clearly specified opportunity.
- Testable entry and exit conditions.
- A plausible source of positive expectancy.
- Realistic assumptions about costs and execution.
- Defined exposure and risk limits.
- Evidence that the approach works beyond the data used to design it.
- Procedures for exceptional market conditions.
- Ongoing monitoring of actual results.
A mechanical strategy makes decisions more consistent and measurable. It does not make the market predictable.
A trading strategy is not a promise of returns. It is a hypothesis about market behaviour, expressed through specific instruments and risk rules, that must be tested and continually evaluated.
Further reading
- The reality of trading
- Derivatives
- Futures
- Options
- Option Strategies: Payoffs, Construction and Risk
- What it costs
- Accounts, orders and product types
- Beware of option selling
- Naked option buying works
- The commodities market
- The forex market
Educational use only
This chapter is intended for education, not investment advice or a recommendation to implement any particular strategy.
Trading carries financial risk. Derivatives can involve leverage, substantial losses, margin obligations and settlement requirements.
The examples are hypothetical. Actual trading results depend on contract terms, prices, volatility, liquidity, execution, transaction costs and applicable market rules.