The reality of trading
What SEBI's research reveals about retail trading losses, why transaction costs matter, and what a mechanical trading system can and cannot control.
The reality of trading coming soon. Follow us on YouTube in the meantime.
This is an educational overview, not financial or trading advice. Every figure here is a historical group outcome from a named document, not a prediction about you. Trading derivatives can lose money quickly, and nothing on this page is a promise in either direction.
The questions
- Is it possible to make money trading the market? If so, how?
- How much return should I expect?
- Is there a guaranteed trading return rate?
Yes, trading can make money, and no, there is no guaranteed trading return rate. The rest of this page is the evidence behind both halves of that sentence.
Scope: what the research does and does not cover
Everything below is about the equity derivatives segment (EDS) in India, individual participants, using data from NSE and BSE.
Whom SEBI means by “individual traders”, in the report’s own definition: resident individuals, Hindu Undivided Families, Non-Resident Indians, sole proprietorships, and individual investors under portfolio management arrangements. That is broader than “small retail”, because it includes high-net-worth individuals.
What that does not establish. These figures are about equity derivatives. They do not directly tell you about:
- Currency derivatives.
- Commodity derivatives.
- Cryptocurrency derivatives.
- Overseas markets.
- All intraday cash-equity trading, which is a separate dataset (SEBI’s July 2024 study, covered below).
- Any particular trading strategy.
And the results describe historical group outcomes, not the probability that you or any specific strategy loses money. That distinction is the one this page is trying to hold onto.
The studies, in order
Five documents, with their publication dates, the period each covers, and what each measured:
| Published | Study | Period covered | Headline |
|---|---|---|---|
| 25 Jan 2023 | Profit and loss of individual traders in equity F&O | FY22 | 89% of individual traders lost; average loss about ₹1.1 lakh |
| 24 Jul 2024 | Intraday trading by individuals, equity cash segment | FY19, FY22, FY23 | 71% lost in FY23; 80% among those making more than 500 trades |
| 23 Sep 2024 | Profits and losses in equity derivatives | FY22–FY24 | 93% lost; 1.13 crore unique traders; net losses about ₹1.81 lakh crore |
| Jul 2025 | Derivatives activity and outcomes update | FY25 | 91% lost; net losses about ₹1,05,603 crore |
| 20 Aug 2026 | Profitability, and trading behaviour, of individual traders in EDS | FY25–FY26 | 87.7% lost in FY26; net losses ₹91,685 crore |
An earlier version of this page called this “seven years of SEBI data”. That was wrong, and the correction matters. What spans seven years is the range of publication dates, from January 2023 to August 2026. The data covers FY22 to FY26, which is five financial years, and the August 2026 report calls it five. SEBI did not publish a comparable profitability study every year for seven years.
Read the periods, not the publication dates. FY26 means April 2025 to March 2026. A study published in 2026 reports on a year that has ended.
The FY25 figure was revised
Worth knowing before comparing years. The July 2025 study reported FY25 net losses of about ₹1,05,603 crore and a 91% loss-maker share. The August 2026 report then revised FY25 to about ₹1.12 lakh crore (₹1,11,788 crore) and 90.9%, because the broker sample was expanded from 13 to 15 firms.
So a page that attributes “₹1.12 lakh crore” to the July 2025 study, as an earlier version of this one did, has merged two documents. This page uses the revised FY25 figures, and says so.
Participation: two different numbers, and why
The August 2026 report contains two sets of trader counts, and they are not interchangeable.
| FY | Full EDS population | P&L sample (top 15 brokers) | Sample coverage |
|---|---|---|---|
| FY25 | 106.30 lakh | 98.10 lakh | 92.3% |
| FY26 | 87.71 lakh | 78.60 lakh | 89.6% |
The difference is a sampling boundary, not a contradiction. Profit and loss data comes from the top 15 brokers by individual trader turnover; participation counts come from the whole segment. The report states that this sample “covers approximately 90% of all individual traders and about three-fourths of individual turnover”.
Where this page gives a participation figure, it is the full population. Where it gives a profitability figure, it is the sample. Nothing here switches between them mid-calculation.
Participation fell 18% year on year, from 106.2 lakh to 87.5 lakh in the report’s headline figures, the first annual decline since FY16. New entrants fell about 40%.
FY26: what the year looked like
| Measure | FY25 (revised) | FY26 |
|---|---|---|
| Aggregate net losses | ₹1,12 lakh crore | ₹91,685 crore |
| Share of traders net loss-making | 90.9% | 87.7% |
| Average net loss per person | ₹1.13 lakh | ₹1.17 lakh |
Three things to keep apart, because they use different denominators:
- Average net loss per person (₹1.17 lakh) divides total net losses across all individual traders in the year.
- Average loss among loss-makers (₹1.47 lakh) divides losses across only those who lost.
- Average profit among profit-makers (₹1.22 lakh) is a third population again.
The average net loss per trader is not the same statistic as the average loss among losing traders, and this page will not add them together or treat them as comparable.
The FY26 improvement deserves the caveat SEBI attaches to it. The loss-maker share fell 3.2 percentage points, but the year also saw a 20% drop in active traders. A smaller share of a smaller group losing money is not evidence that outcomes improved.
The longer-run totals put a good year in context. SEBI reports that over the five years FY22 to FY26, individual traders incurred aggregate net losses of about ₹3.85 lakh crore in the equity derivatives segment. Within that, the two years FY25 and FY26 alone accounted for about ₹2.03 lakh crore, against about ₹1.81 lakh crore across the whole of FY22 to FY24. Individual traders lost more in two years than in the three years before.
That ₹3.85 lakh crore is a report-level aggregate, and it is worth reading carefully. It is SEBI’s own figure, in the August 2026 report. But it combines years whose underlying figures rest on different sample coverage (from 83% of the population in FY22 to 92.3% in FY25) and includes the revised FY25 number. So it is not a like-for-like sum of the separately published studies, and a reader who adds the July 2025 study’s own FY25 figure (₹1,05,603 crore) to the same years will arrive at a different total. Take it as SEBI’s aggregate for the segment over five years, not as a precise arithmetic reconciliation of the individual reports.
Product groups: futures, options, and both
Table 21 of the August 2026 report, for the combined FY25–FY26 period. These are unique traders across the whole two years.
| Product used | Traders (lakh) | Loss-makers | Average net P&L per person |
|---|---|---|---|
| Only futures | 0.92 | 67.3% | −₹2.94 lakh |
| Only options | 113.95 | 91.6% | −₹1.27 lakh |
| Futures and options both | 7.75 | 84.8% | −₹7.30 lakh |
| All | 122.62 | 91.0% | −₹1.65 lakh |
What the table actually supports:
- Only-options participants had the highest loss-maker percentage, 91.6%, and were 93% of all traders. They accounted for about 71% of the two-year losses.
- Both-products participants had the largest average loss per person, ₹7.30 lakh, about 5.8 times the only-options average. They were 6.3% of traders and about 28% of the losses, which the report attributes to substantially larger trading exposure.
- Only-futures had the lowest loss-maker percentage at 67.3%, and roughly a third of that group ended profitable. It was also the smallest group, 0.75% of traders.
Three cautions this table does not support.
These are observational differences between groups of people, not controlled comparisons of otherwise identical strategies. The groups differ in exposure, capital, product choice and who they are, and none of that is held constant.
Do not read it as “futures are safer”. A futures contract carries real obligations: daily settlement, margin calls, and for eligible contracts the possibility of physical settlement. A majority of the only-futures group still lost money, and an average loss of ₹2.94 lakh is not small.
And “both is the worst” is not a strategy finding. Choosing to trade both products is not what caused a ₹7.30 lakh average loss. Traders who do both trade more, take larger positions and hold different risk. The table describes who lost what, not what to do.
A related pair of numbers that look contradictory and are not: in FY26, loss incidence was 87.7% among options traders and 66.0% among futures traders. Those are the two product categories in that year. The 67.3% above is the only-futures group over two years. Different measure, different period, both correctly labelled.
Who lost the most, and who made money
- Losses are concentrated. In FY26, about 23% of traders accounted for nearly 90% of total losses.
- Options were the whole story. Options trading was about 92% of aggregate individual losses in FY26.
- Turnover concentrated in near-expiry contracts. In FY25, 70% of index options turnover happened on expiry day itself, 80% within one day of expiry and 98% within a week; after SEBI’s November 2024 measures those moderated to 59%, 75% and 97%.
Other participant categories, FY26 gross trading profits (before transaction costs): proprietary traders about ₹44,000 crore, FPIs about ₹14,000 crore, corporates about ₹8,000 crore, mutual funds and partnership firms about ₹3,000 crore each. Individual traders recorded a gross trading loss of about ₹72,000 crore, down from about ₹98,000 crore.
On algorithmic trading, be precise. The report states that 99% of the profits of FPIs and proprietary traders were made by “algo entities”, and it defines an algo entity as an entity that executed at least one algorithmic order during the year. That is the whole definition.
So it does not support the claims people make from it: that every profitable trade was algorithmic, that algorithmic systems caused those profits, that institutional algo activity is the same thing as a retail algo strategy, or that automating execution creates an edge. It says that entities who used at least one algo order accounted for most of those categories’ profits. That is all.
Transaction costs: gross and net
Net P&L = Gross P&L − Transaction costs
SEBI’s reported net losses already include transaction costs. They are not an additional loss to be added on top a second time. An earlier version of this page described them as “costs paid on top of losses”, which double-counts them.
The clearest evidence that costs are already inside the net figure is the gap between the two bases in FY26:
| Basis | Loss-makers, FY26 |
|---|---|
| Gross, before transaction costs | 82.1% |
| Net, after transaction costs | 87.7% |
Transaction costs pushed some traders with small gross profits into net losses. About 4.4 lakh traders in FY26 who had earned gross trading profits became net loss-makers after costs; in FY25 the equivalent figure was 5.3 lakh. That is roughly 5 to 6% of all net loss-makers in each year.
Magnitudes:
- Individual traders incurred about ₹25,000 crore in transaction costs in each of FY25 and FY26.
- Over FY22–FY26, cumulative transaction costs were about ₹1 lakh crore, with brokerage nearly half.
- Costs were 35% of gross losses for loss-makers, against 21% of gross profits for profit-makers.
- STT paid by individuals rose 35%, from ₹4,920 crore in FY25 to ₹6,645 crore in FY26.
A note on how these arrive. The cost figures rest on the same broker sample as the profitability data, so their coverage is “approximately 80% of the turnover of nearly 90% of individual traders” rather than the whole segment. Treat the totals as large and directionally right rather than exact to the crore.
A worked example
A hypothetical trader, not a SEBI case study:
| Gross trading profit | ₹50,000 |
| Brokerage and other transaction charges | ₹55,000 |
| Net trading P&L | −₹5,000 |
₹50,000 − ₹55,000 = −₹5,000.
The trading decisions made money. The account did not. That is what a small gross edge looks like once costs are paid, and it is the mechanism behind the 82.1% becoming 87.7%. Costs are incurred on every executed trade, whether or not the trade was a good one. See what it costs.
Intensity, portfolio size, and who loses
Trading intensity. The report finds losses concentrated among high-turnover participants, and that traders with turnover large relative to their portfolio are more likely to lose. It also notes that the average number of trades by loss-makers exceeded that of profit-makers.
Turnover is associated with losses; it is not established as the sole cause. Traders who trade more tend to carry more leverage, take larger positions, hold longer, choose different strategies and have different capital. The relationship is real and consistent, and the causal story is not proven. Cutting your trade count does not by itself produce a profit.
Portfolio size. The chance of a net loss declines as the equity portfolio grows:
| Equity portfolio | Loss rate |
|---|---|
| No holdings, or below ₹50,000 | 93% |
| ₹1 lakh to ₹10 lakh | 88% |
| ₹50 lakh to ₹1 crore | 72% |
| Above ₹10 crore | 58% |
How the portfolio is defined matters, so here it is: the market value of all listed equity and equity-oriented mutual fund holdings at the end of FY25 and FY26, taken from depository holdings data at NSDL and CDSL on 31 March of each year.
- Of 122.6 lakh EDS traders across FY25–FY26, about 43 lakh (35%) had no underlying equity portfolio at all.
- About 95 lakh (78%) had portfolios below ₹1 lakh. They contributed 51% of turnover and 70% of total losses.
This is an association, and a strong one, but it is not a prescription. Portfolio size travels with income, capital, experience and risk appetite. Telling someone to buy more equity so their derivatives trading improves gets the finding backwards. And equity portfolio value is not the same as the capital in a trading account, which is what actually determines whether a position can be held through a drawdown.
Demographics
- Age. Traders under 30 were 43% of all individual traders in FY26, up from 31% in FY22. 89% of the under-30 group lost money in FY26, against 81% of those over 60.
- Income. About three-fourths of individual derivatives traders declared annual income below ₹5 lakh. In FY26 that group was 43% of turnover but 53% of aggregate losses, and 88% of them lost money, against 81% of those declaring above ₹1 crore.
- Geography. Traders outside the top-30 cities were about two-thirds of individual traders and nearly half of derivatives turnover, while holding a much smaller share of individual mutual fund assets.
Two caveats SEBI states and this page will keep.
Income data was available for only about 55% of the FY26 individual trader sample, because of limited data availability. Every income finding above rests on that partial coverage.
None of this establishes that age or income causes losses. Younger traders may trade more aggressively relative to their resources, and lower-income groups may hold derivatives exposure that is large relative to their income. Those are descriptions of who traded and what happened, not explanations. Nothing here is a statement about a person because of their age or income.
Experience: what SEBI found, and what it did not
An earlier version of this page said flatly that “experience does not help”. SEBI’s actual finding is narrower, on the new-versus-regular comparison in the August 2026 report:
- In FY26, 87.81% of new traders and 87.69% of regular traders lost money. In FY25, around 91% of both groups lost. The report’s own conclusion is that “prior trading experience did not appear to materially affect the likelihood of incurring losses.”
- Regular traders lost more money each. Average net loss in FY26 was ₹1,35,716 for a regular trader against ₹58,620 for a new one, because regular traders carried far larger exposure: about 45.7 times their portfolio value in turnover, against 19.2 times for new traders.
- Regular traders were 75% of traders but 92% of turnover and 88% of net losses in FY26.
So: SEBI observed persistent losses among continuing traders, and found no simple relationship in which more years of participation produced profitability. That is the finding.
What the data cannot establish, in either direction. It cannot show that learning has no value, and it cannot show that all continuing traders improve. Years of participation, number of trades, capital, skill and strategy quality are different things, and a group average cannot separate them. Survivorship matters too: traders who quit after losses are not in the later year’s numbers.
Can trading make money, and what should you expect?
Can it make money? Yes. Some individuals and a number of institutions achieve positive trading results. In the same FY26 data in which 87.7% of individuals lost, proprietary traders and FPIs recorded large gross profits.
Is there a guaranteed return? No. No market-trading return is guaranteed by taking part in a strategy, and no SEBI document reports a prospective return for a strategy, because that is not what these studies measure.
What should a beginner expect? There is no defensible universal annual return figure to give you, and any page quoting one is inventing it. What the evidence supports is narrower and more useful: the possibility of a substantial loss is real, and historical profitability does not establish future profitability.
Realised results depend on the strategy, position sizing, capital, costs, liquidity, leverage, market conditions and execution. Several of those are under your control and several are not.
The Turtle Traders, and what that story does and does not show
In the 1980s Richard Dennis ran what became known as the Turtle programme: a group of novices were taught a complete, written, mechanical rule set covering markets, entries, exits, position sizing and risk limits, and several went on to manage money.
It is a useful illustration of one point: that a systematic procedure can be written down and taught to people who did not invent it. That is worth knowing, because it separates “having a method” from “having a gift”.
It is not a controlled experiment proving that mechanical rules reliably create successful traders. It was a small, uncontrolled, self-selected group, run by people with a strong prior, in markets of that era, and the results are reported informally rather than as a peer-reviewed study with a defined survivorship treatment. This page therefore does not quote Dennis directly and does not reproduce performance statistics, because the commonly circulated versions cannot be traced to a primary source. Treat the story as a demonstration that rules can be specified and followed, not as evidence that they work.
What follows from that is narrower than it sounds. Mechanical rules remove some decision noise. Whether they make money depends entirely on whether an edge exists and persists, which is an empirical question and not a property of having rules.
What a mechanical system actually decides
A mechanical system is a set of rules written before you trade, so the decision is made once and applied repeatedly. A complete plan defines:
- Which markets and instruments.
- Which sessions and which dates are eligible.
- Entry conditions.
- Exit conditions.
- Position sizing.
- Maximum exposure.
- Stop-loss and risk limits.
- Profit-taking or trailing-exit rules.
- Maximum simultaneous positions.
- Correlated exposure, so five positions are not one bet.
- Margin requirements.
- How expiry and physical settlement are handled.
- Contract rollover rules, where they apply.
- Trading cost and slippage assumptions.
- Conditions under which you suspend trading.
- What happens on rejected, delayed or partially filled orders.
Separate the strategy from the plumbing. Your rules decide what you want to do; the broker’s order-management and risk systems decide whether the order is accepted, and the exchange decides whether it trades. Those are different layers, and the next section is about the second one.
And not every event can be predetermined. A mechanical system still needs operational monitoring and a procedure for the conditions it did not anticipate. “The rules cover everything” is a claim about design, not a guarantee about the world.
Edge and expectancy
An edge is a repeatable advantage that produces a positive expected result under stated assumptions. The arithmetic for a simple model:
Expected P&L per trade = (Win probability × Average win) − (Loss probability × Average loss) − Expected costs per trade
A hypothetical example:
| Input | Value |
|---|---|
| Probability of a winning trade | 40% |
| Average winning trade | ₹3,000 |
| Probability of a losing trade | 60% |
| Average losing trade | ₹1,500 |
| Expected costs per trade | ₹150 |
(0.40 × ₹3,000) − (0.60 × ₹1,500) − ₹150 = ₹1,200 − ₹900 − ₹150 = ₹150 per trade
This is hypothetical positive expectancy, not a promise. It does not mean the next trade makes ₹150, that any single trade makes ₹150, or that these inputs hold next month.
Five things the formula makes clear:
- Win rate alone tells you nothing. This example wins 40% of the time and is profitable.
- Average win size matters, and so does average loss size.
- Costs can eliminate an apparent edge. At ₹250 of cost per trade, this example loses money.
- The probabilities are estimates, not known quantities.
- Rare large losses can invalidate a simple average. One −₹50,000 day is not captured by an “average loss” of ₹1,500.
For interest, a rule of thumb falls out: with a win rate p, average win W and average loss L, you need p × W > (1 − p) × L before costs.
Testing: backtests and their failure modes
- Backtesting applies fixed rules to historical data.
- Overfitting means tuning parameters until they fit the past, which is easy and usually useless.
- Out-of-sample testing evaluates the rules on data that was not used to develop them.
- Walk-forward testing repeats fit-and-test through time, so each period is tested on data it has not seen.
- Forward testing runs the system on later live market data, usually with simulated execution, before committing size.
Forward testing with live data and simulated fills is not live trading. It removes the slippage, partial fills and psychological weight of real orders. That is the point of it and the limit of it.
Nine things that make a backtest lie:
- Slippage, the gap between the price you see and the price you get.
- Trading costs, often modelled too optimistically.
- Liquidity, so the size you tested cannot actually be filled.
- Partial fills, leaving legs of a position unhedged.
- Survivorship bias, from testing on instruments that still exist.
- Look-ahead bias, from using information that was not available at the time.
- Corporate actions, if prices are not adjusted correctly.
- Rollover assumptions, which hide the real cost of holding a futures position.
- Changes in market structure, including the rule changes SEBI has repeatedly made in India.
A passing backtest does not prove future profitability. It establishes that the rules would have worked on the data you had, after the assumptions you fed them.
Risk management
A positive estimated expectancy is not a reason to skip risk control, because expectancy is an average over many trades and you can be ruined before the average arrives.
The variables that matter: position size; the maximum loss you will accept on one position; leverage; total portfolio exposure; correlated positions that lose together; drawdown; margin calls; liquidity; gap risk; and tail risk, the rare large move that decides the outcome.
A stop-loss is an instruction, not a guarantee. It can fail to fill at your price when the market gaps or moves too fast, and a stop can be triggered by a brief move before the price returns. A risk limit reduces some losses; it cannot promise a maximum realised loss in every condition.
Nothing in this section prevents account ruin. Reducing size, diversifying and setting limits make ruin less likely. They do not make it impossible, and any page claiming otherwise is overstating what risk management is.
Drawdowns and losing streaks
A system with a positive estimated edge still loses trades, and can lose many in a row. A hypothetical illustration: a position or portfolio at ₹10,00,000 falls to ₹6,50,000, a 35% drawdown, and needs a 53.85% gain from the reduced value simply to return to the starting point.
What that means:
- A losing streak is not automatically proof that the strategy is broken. Losing runs occur inside sound processes.
- But persistent underperformance may mean the original assumptions no longer hold, which is a different conclusion and needs a different response.
- Size positions for conditions you would find uncomfortable, not for the average.
- Match your capital reserves and risk limits to the system’s uncertainty.
Do not assume every drawdown can be solved by trading smaller. Reducing size reduces the amount lost; it does not create an edge that was never there.
One overstatement to avoid, which an earlier version of this page made: it is not true that every sound system must go months without a gain. That is one possible pattern, not a requirement, and treating it as a rule leads people to hold on to systems whose problem is the strategy rather than the streak.
Execution and automation
Six stages, which people collapse into one and then are surprised by:
| Stage | What happens |
|---|---|
| Signal | Your rule identifies a possible trade |
| Submission | The order is sent, by you or by software |
| Acceptance | The broker’s and exchange’s controls accept an eligible order |
| Execution | The order actually trades |
| Position management | Holdings, obligations and margin are monitored |
| Settlement | The money and securities obligations are completed |
Things that go wrong between them: rejected orders, partial fills, broker risk-management controls blocking or squaring off a position, insufficient margin, position data that is stale, delayed execution, multi-leg orders where one leg fills and the other does not, and outright broker or exchange interruptions.
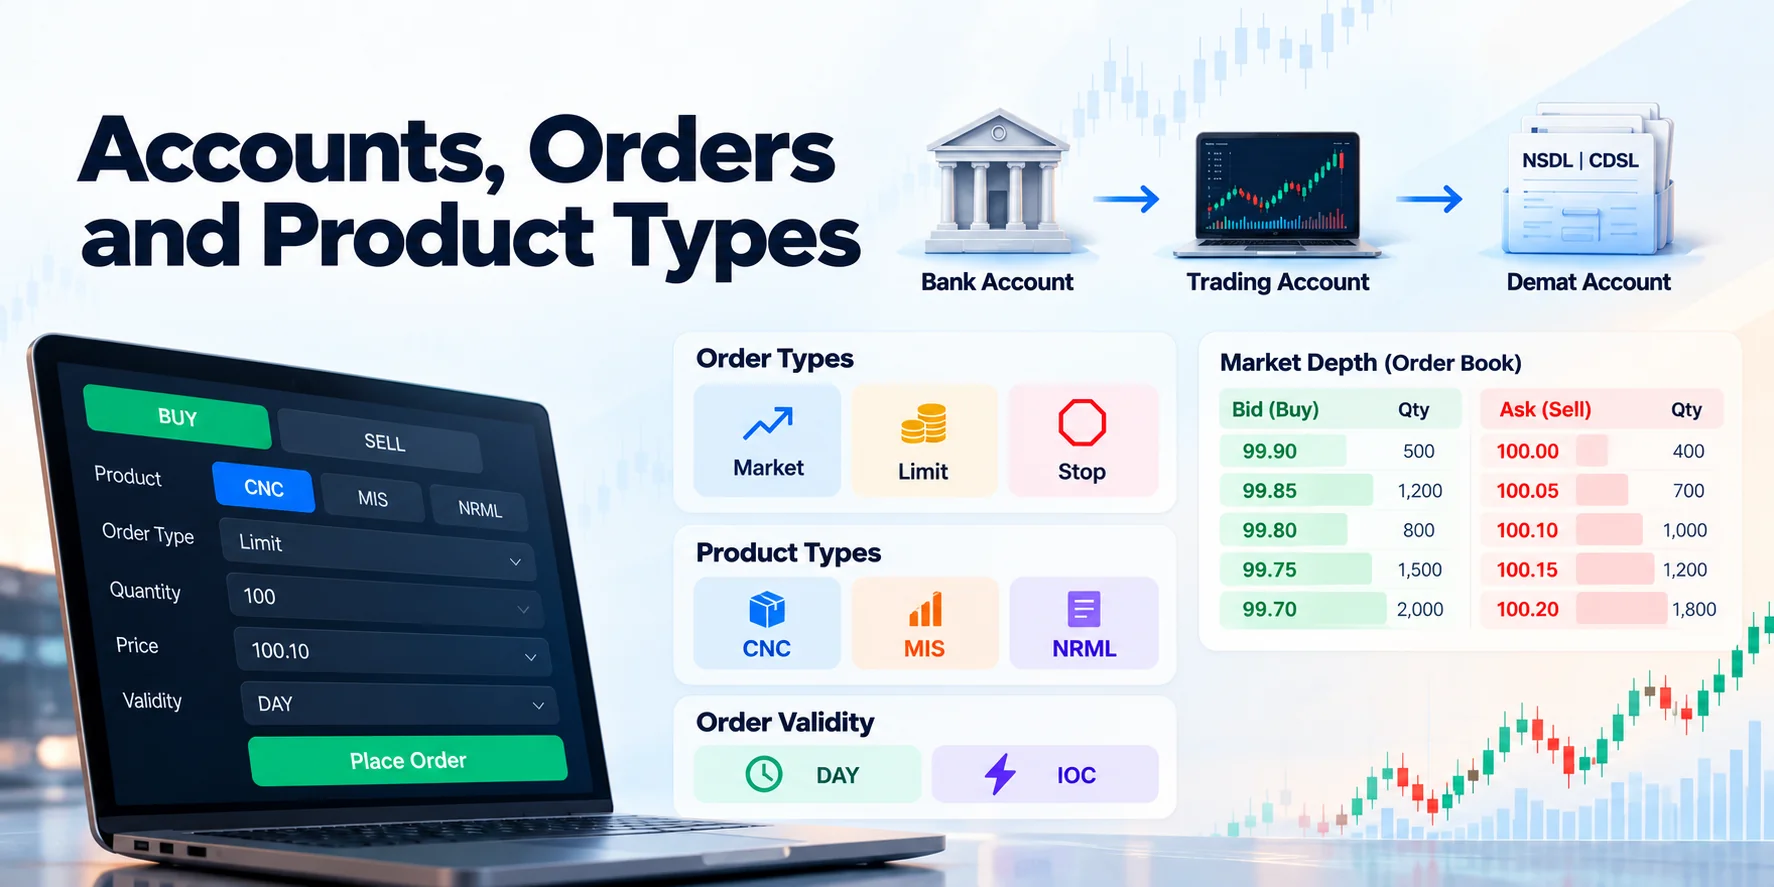
Automating order submission does not guarantee execution. It removes some of your reaction time and some of your hesitation; it does not remove the broker’s controls, the market’s liquidity, or a rejected order. See accounts, orders and products for the mechanics.
What systematic trading can and cannot do
It can help with:
- Consistency of decision-making.
- Rules you can state and repeat.
- Testability, because rules can be examined.
- Record keeping, because the plan is written down.
- Position-sizing discipline.
- Removing some discretionary and emotional decisions.
It cannot guarantee:
- That an edge exists.
- That historical data is accurate or free of bias.
- Future market conditions.
- Available liquidity when you need it.
- Execution at the price you wanted.
- That your broker or the exchange stays up.
- Protection from every tail loss.
- A positive future return.
A mechanical system is a way to specify, test and implement a trading process. It is not evidence that the process is profitable.
What follows
- The base rate is about nine in ten individual equity-derivatives traders losing money. Any approach starts from that baseline.
- Loss rates differ by product and by group, and those differences are observational, not instructions.
- Population statistics are not predictions about you. They are the odds facing an undifferentiated entrant.
- Transaction costs are economically decisive, because they turned a gross 82.1% loss rate into a net 87.7% in one year.
- More activity is not better. The evidence consistently points the other way.
- Risk management is necessary and not sufficient.
- An identifiable edge matters more than a tidy rule set. Rules without an edge just lose money consistently.
- Backtesting cannot eliminate uncertainty.
- Automation guarantees neither profits nor execution.
- Do not trade money you need for essential living expenses. No expected value calculation changes that.
A mechanical system can make trading decisions consistent and testable. Only evidence from reliable testing and subsequent performance can support a claim that the system has an edge, and that edge can disappear.
Next: taxation.
Sources and dates
Every figure on this page comes from one of these documents. The table is the one at the top of the page; this section records the basis, the populations and what was removed.
Which document each figure came from. The FY25–FY26 findings, the product-group table, the portfolio table, the gross-versus-net comparison, the demographics and the transaction-cost details are from the two August 2026 reports. The FY22 figures are the January 2023 study. The FY22–FY24 figures are the September 2024 study. The FY25 figures are from the July 2025 update, as revised in the August 2026 report. The intraday cash figures are the July 2024 study and are a different segment, which is why they are labelled separately throughout.
Basis, where it matters. Reported net losses are after transaction costs. Category-wise participant figures for FY26 are gross, before transaction costs, and exclude open positions at the end of FY26, which is why the individual gross loss (₹72,000 crore) and the net loss (₹91,685 crore) differ. Profitability figures rest on the broker sample described above; participation figures are the full segment. Income findings rest on the 55% of the FY26 sample for which income data was available. Transaction-cost totals rest on the same broker sample as the profitability data.
What this page removed, because it could not be verified or was mathematically wrong:
- The “seven years of SEBI data” framing. The publications span that period; the data covers five financial years, FY22 to FY26.
- The sentence claiming only one trader in a hundred was profitable. 7.2% were profitable over FY22–FY24 and about 1% exceeded ₹1 lakh.
- A multi-year loss-persistence percentage, which appears in neither the September 2024 nor the August 2026 report.
- The attribution of the revised FY25 loss figure to the July 2025 study.
- The treatment of transaction costs as additional to net losses, which double-counted them.
- A direct quotation attributed to Richard Dennis, and Turtle programme performance statistics, neither traceable to a primary source.
- The claim that futures are inherently safer than options, and that trading both is universally the worst approach.
Retail trading can lose money quickly, and a systematic approach is not automatically the answer.